The starting run: sizes, colorways, and how many of each
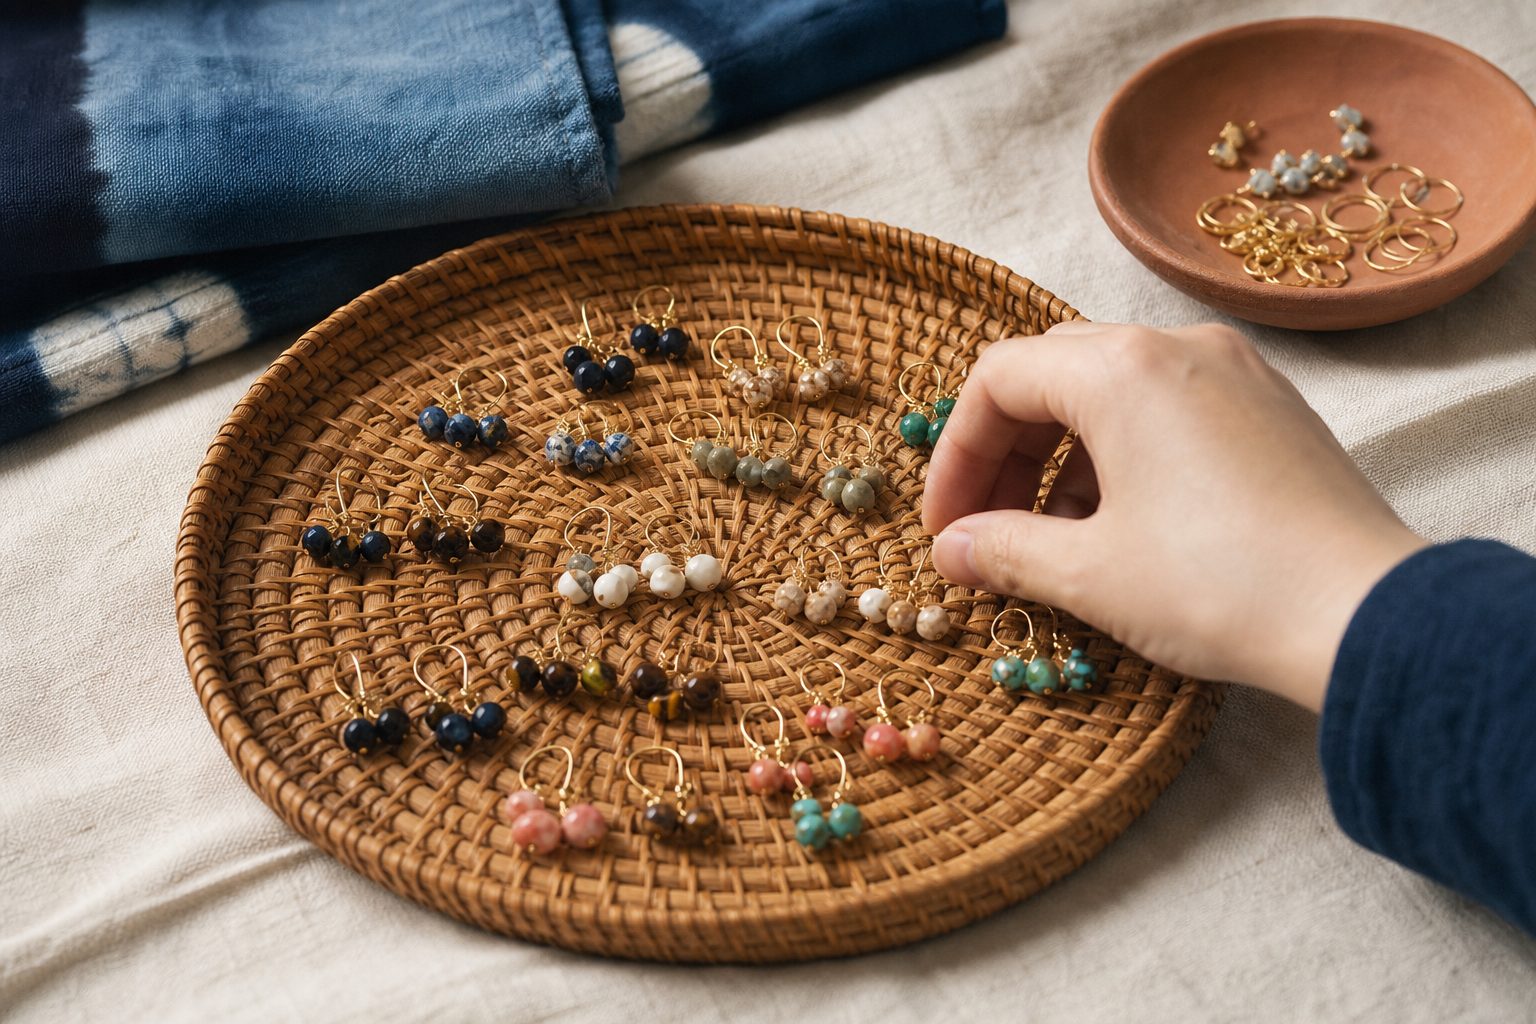
When the season opens, most makers face the same planning challenge: how to decide which designs, sizes, and colorways to make, and in what quantities. For this case, the focus is on one line of earrings, a simple geometric dangle, offered in three sizes (small, medium, large) and five colorways. The maker has sold these before, but never across a full, six-show season that ranges from an April street fair to a December holiday market.
The initial run is based on last year's most popular combinations. The maker produces twenty pairs each of the two most popular colorways in medium and large. Ten pairs each for the remaining colorways, split across all three sizes. The smallest size gets only five pairs per colorway, since it sold slower last year. This first production batch takes three days to finish, with each pair bagged and labeled immediately to minimize mix-ups later.
Before the first event, the full batch is entered into a spreadsheet with columns for size, color, and a unique SKU per variant. This will form the baseline for all future tracking. The box for the season is organized with labeled sub-containers per size and colorway, so restocking and counting will be faster at each event.
Keep reading: Cashless Markets and Card Fees: What Makers Pay to Get Paid
Counting in and counting out at every single show
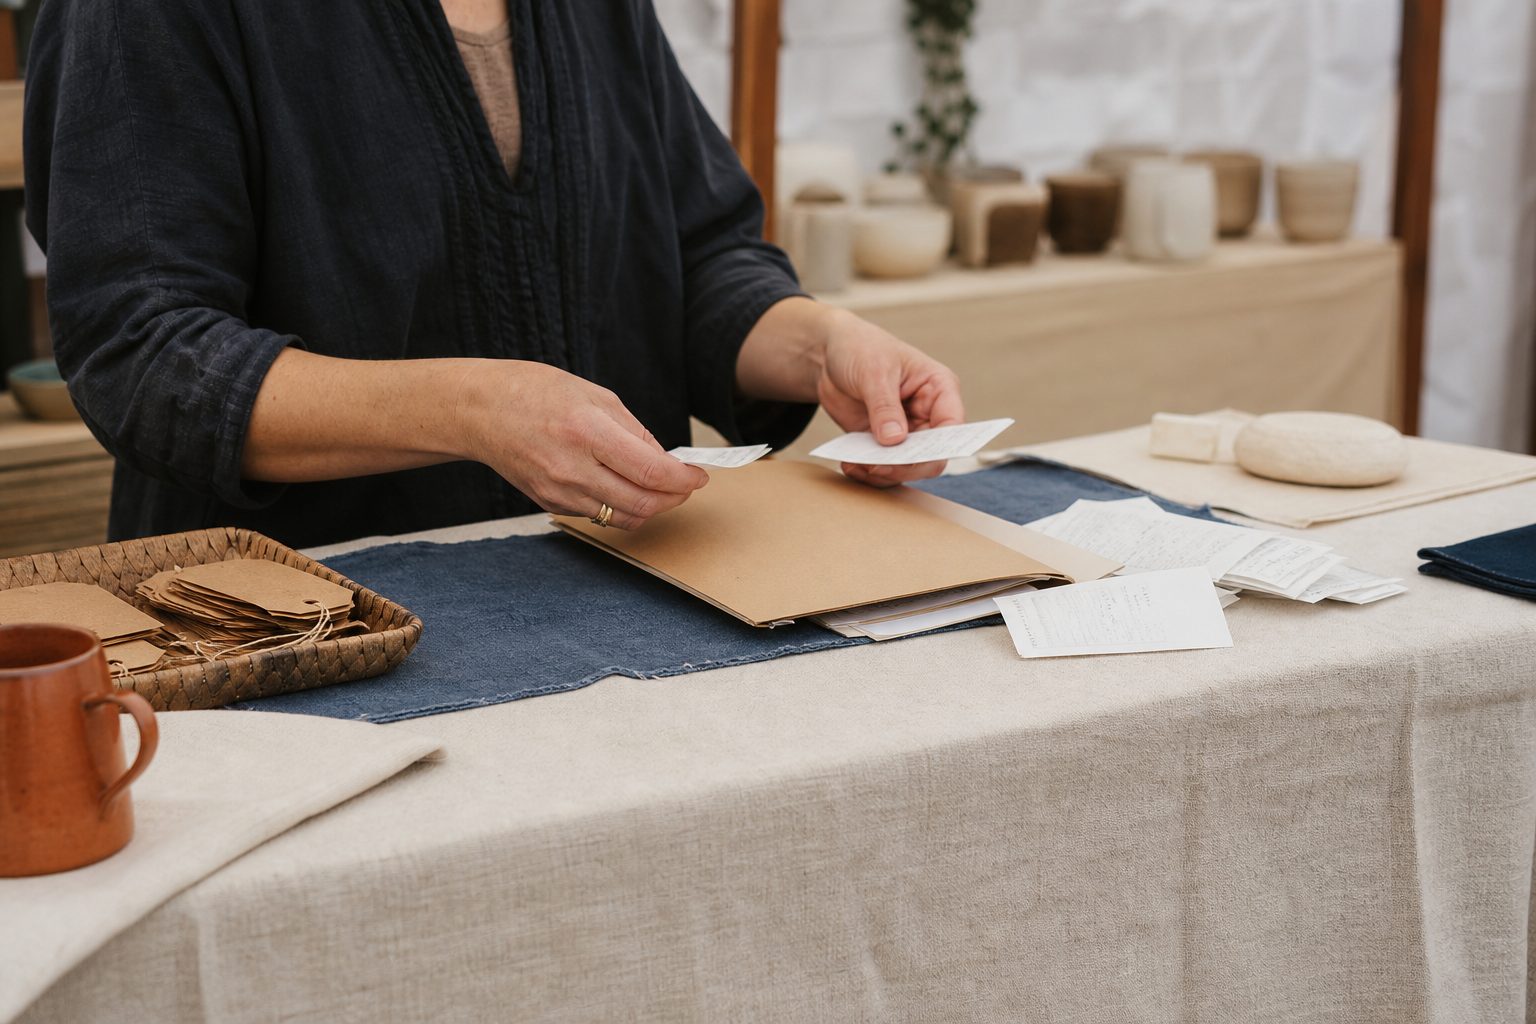
Inventory tracking for craft fairs can get chaotic fast. At each event, this maker sets aside twenty minutes before opening to count how many of each earring variant are packed for the day. A printed sheet lists all SKUs, with columns for "in" and "out" counts. The starting number is checked against the spreadsheet, and any discrepancies are corrected before the show starts.
Sales are tallied on a small notepad at the table, with a tick next to each SKU as a pair is sold. When the show ends, the remaining inventory is counted back into the box. The difference between the "in" and "out" numbers, minus any pairs that were damaged or given away for promotion, gives the real sales figure for the day. This process repeats at every event, regardless of how busy the show is.
By week three, the maker notices how much easier restocking has become. Each count highlights which variants need replenishing. Instead of guessing, production sessions are targeted: only the colorways and sizes that dropped below the threshold are remade, saving time and materials.
Reading sell through by show rather than by month
Many makers look at their sales on a monthly basis, but this can hide important details. By tracking the starting and ending inventory for each event, the maker can see exactly which earrings move at each location. The spring street fair draws mostly local shoppers, and sales skew toward bright colors in medium sizes. The indoor art market two weeks later shifts to neutral tones and the smallest sizes.
Comparing event sales side by side, it becomes clear that even back-to-back shows can have different buying patterns. For example, a Saturday night pop-up in June sees more large earrings sold than at any other event, likely due to a younger, night-out crowd. The numbers make it easy to adjust the next pack list: more large pairs in bold colors, fewer of the small neutrals.
This level of per-event detail also helps avoid overproduction. Instead of making fifty pairs of every variant for the season, the maker can wait until a specific show proves a need for restocking. Waste is reduced, and storage bins are less cluttered.
Keep reading: A Saturday on the Aisle: Traffic, Weather, and Load Out
The colorway that only sells at outdoor summer shows
One detail emerges after three outdoor shows: the turquoise and yellow colorway barely moves at indoor events, but sells out on sunny days. The pattern is obvious when counts are tracked by show, not just in total. At the two June street fairs, every pair in this color sells by mid-afternoon. At an indoor September market, not a single pair leaves the table.
This trend makes it easy to decide what to pack for each event. For outdoor summer shows, the maker doubles up on this colorway, even at the expense of packing fewer neutrals. For indoor fall shows, the turquoise and yellow pairs are left at home, making room for extra inventory of the more muted shades that move better in that setting.
The ability to see these patterns only comes from event-level tracking. What looks like a poor seller in aggregate can be a seasonal hit in the right context.
When a strong seller runs out at hour three
At the biggest July festival, the medium-sized earrings in rose gold vanish from the table by noon. This variant had sold steadily in past shows, but not at this pace. The maker missed out on several sales from customers who wanted that specific color and size, but found the spot empty.
This is a turning point for inventory planning. For the next show, the maker increases the quantity of this variant by 50 percent. The packing list is rebuilt to make sure this SKU gets double the shelf space, and a small sign is added to invite customers to check back later in the day for restocks.
The lesson is clear: real-time tracking can catch these hot streaks before they cost too much in lost sales. The next event sells out of the rose gold again, but only an hour before closing, capturing more sales than last time.
See how BoothInventory handles this for craft and maker commerce
Rebuilding the pack list from the last run of the same show
As the season moves to familiar venues, the maker digs into last season's records. The October craft fair is a repeat event. Last year, large gold pairs barely moved, but small black variants sold out. The maker uses the pack lists and sell-through rates from that specific show to fine-tune the current inventory.
For this event, the box includes only a handful of large gold, but doubles up on small and medium black pairs. The results match expectations. Nearly every black pair is gone by closing, with gold and turquoise mostly left over. The pack list for the following year is already half-written based on this year's outcomes.
This approach turns last year's notes into a production plan. Instead of starting from scratch or relying on memory, the maker builds each show's inventory from real historical data. The process becomes more efficient with each season.
Retiring a variant and deciding what replaces it
Over the season, the silver and blue colorway in large size fails to sell at any show. By the fourth event, the maker decides to retire this variant. The remaining pairs are discounted at a fall market, but even at a lower price, only one sells.
For next season, the maker considers which new color to introduce. Reviewing event-level data, it's clear that earth tones in smaller sizes performed better across all venues. The decision is to replace the silver and blue large pairs with a new olive green medium variant, which matches current style trends and customer requests from the last two shows.
Retiring a variant is always a gamble, but with show-by-show records, the choice is based on evidence rather than guesswork. The new color is ready for sampling at the first spring event of the next cycle.
What the season revealed about which shows to enter again
With a full season of event-level inventory records, the maker sits down in January to review profitability and sell-through by show. Two events stand out for strong total sales and high sell-through rates, especially for the signature colorways. A third show, despite high foot traffic, produced lower profits due to higher booth fees and slower-moving inventory.
Looking at the data, the maker spots a pattern: outdoor summer shows bring higher unit sales per hour, especially of bright and bold colors. Indoor winter events, while smaller, result in fewer leftovers and higher average price per pair. One holiday market did not justify the time and travel, with most sales coming from discounted pairs or slow-moving variants.
This analysis makes it clear which shows to prioritize next year. The maker plans to return to the top two markets, skip the least profitable one, and add a new street fair that matches the profile of the most successful events. The decision is based on real numbers, not just a feeling of how busy a booth felt at the end of the day.
Tracking each product line by individual event transforms the guesswork into a repeatable process. Tools that support per-show inventory and sales tracking, restock planning, and profit comparison help makers make these decisions with confidence. BoothInventory provides this kind of structure, letting artisans focus more on what to make and less on what to count.